Moodee Studio is a multidisciplinary creative agency specializing in brand strategy, brand identity, and website design for founders ready to elevate how their business is perceived online.
Brand & Web Design done in house.

Not sure which Shopify metrics actually matter? Learn how to use conversion rate and average order value to make smarter decisions for your ecommerce store.
Web Design

If you have a Shopify store, you have access to an almost ridiculous amount of data. Sessions, traffic sources, add-to-cart rate, conversion rate, returning customers, average order value, checkout behavior, sales by product, sales by channel... and that's before we even get into what Meta, Google, Klaviyo and the rest of your tech stack are telling you.
Which is great, until you actually open Shopify Analytics and realize you're looking at 47 numbers and have absolutely no idea which ones deserve your attention.
You don't need to become an ecommerce data analyst to make better decisions about your store, and you definitely don't need to understand every metric Shopify gives you. If you're just starting to pay attention to your numbers, I'd begin with two: conversion rate and average order value.
They give you a pretty useful snapshot of what's happening once people get to your store, and more importantly, they can help you figure out where to look when sales aren't doing what you want them to do.
Your conversion rate is simply how many people who visit your store actually buy something, so if 1,000 people visit your store and 20 of them buy, your conversion rate is 2%.
The number itself isn't particularly complicated, but it's one of those metrics that becomes much more interesting once you start using it to ask questions.
Because traffic can be a seductive little thing, it can look really good on paper while doing absolutely nothing for your bank account.
Seeing thousands of people visit your website feels like a good thing, and obviously you want qualified people finding your store, but 20,000 sessions don't mean much if almost nobody is buying. It's a little like having a packed restaurant where everyone takes a menu, compliments the decor and then leaves without ordering dinner [very flattering, not particularly useful].
So when someone says, "We just need more traffic," my first question is usually, "Okay, but what is the traffic you already have doing?"
That's where conversion rate earns its keep.
You can find your conversion rate inside Shopify Analytics, and Shopify also lets you look at the different stages people move through on their way to purchasing, including sessions that add something to the cart, reach checkout and complete the order.
That gives you a much more useful picture than the conversion rate alone.
If you're getting plenty of product views but very few add-to-carts, I'd be looking closely at the product page.
→ Is the offer clear?
→ Does the photography actually help someone understand the product?
→ Is the copy answering the questions they have before buying?
→ Is the price making sense compared with what they're getting?
If people are adding products to their carts but disappearing before checkout, I'd start looking at the cart experience, shipping, unexpected costs and anything else that might make someone hesitate.
And if people are actually reaching checkout but not completing their purchase, you've narrowed the problem down even further.
Now you have something to investigate instead of sitting there looking at your sales total wondering why the universe has decided to humble you this month.
That's what makes conversion rate useful, it gives you a place to start.
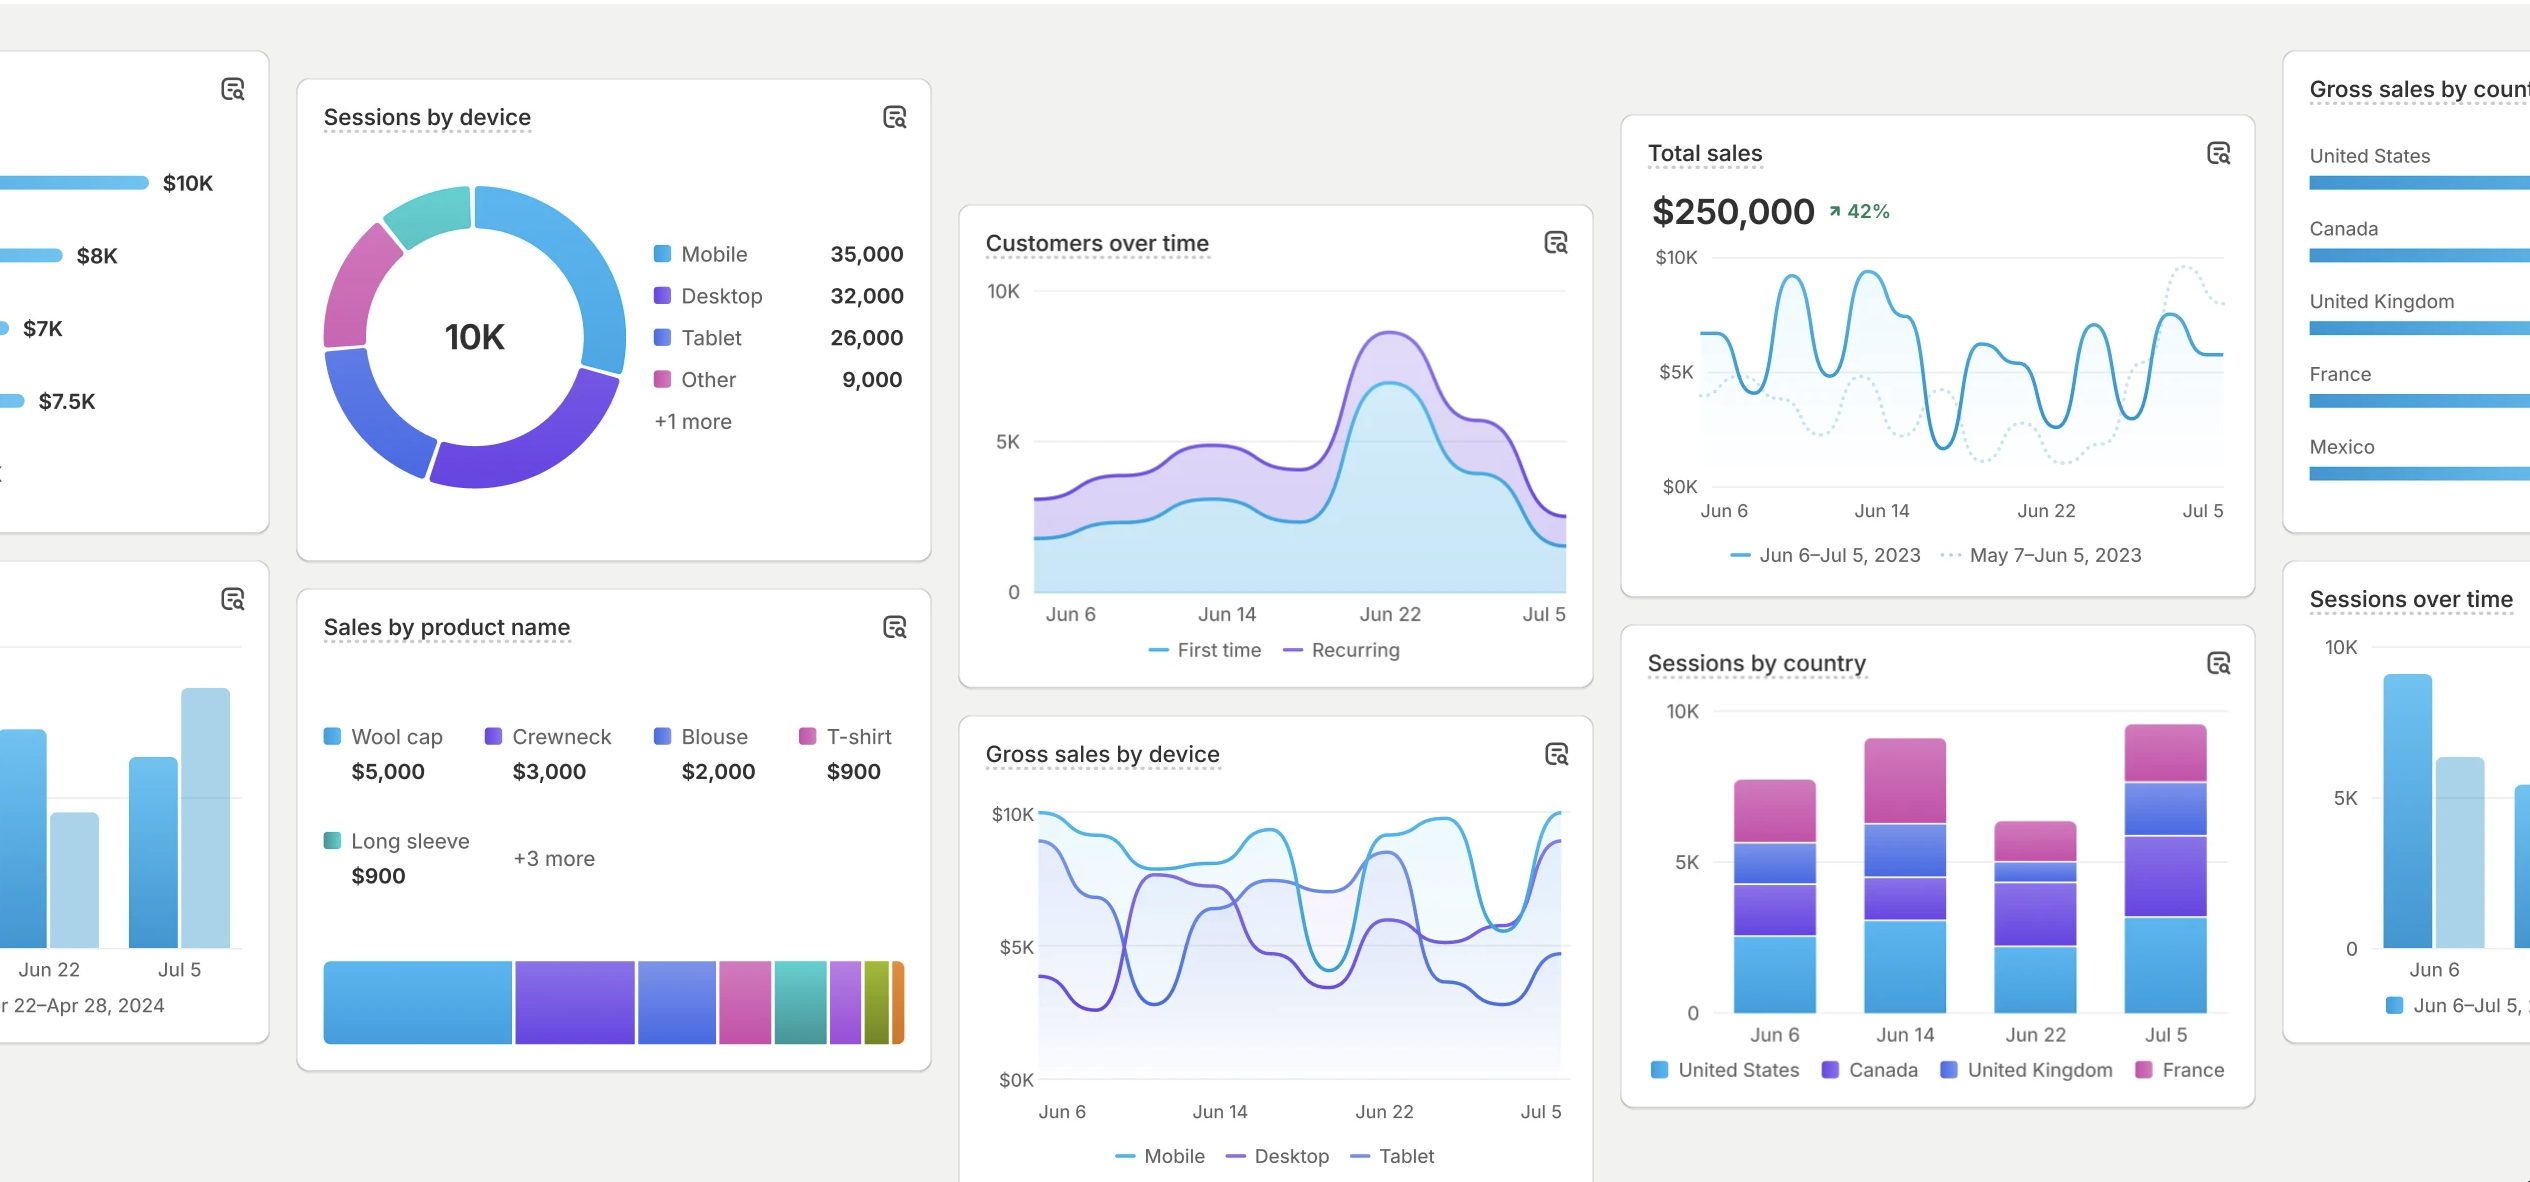
The second number I'd pay attention to is average order value, or AOV, which is simply the average amount customers spend per order.
If 100 orders generate $8,000 in sales, your AOV is $80.
Again, very simple math, but the number can tell you quite a bit about how people are shopping with you.
Let's say you're getting 1,000 orders a month at an $80 AOV, which puts you at $80,000 in sales. If you can get that AOV to $90, you're at $90,000 with the same number of orders.
That's why I like looking at AOV alongside conversion rate. Conversion tells you how many visitors are becoming customers, while AOV tells you how much those customers are spending when they do.
Once you know your AOV, you can start looking for patterns that might help you increase it without turning your website into one giant upsell machine.
Maybe customers who buy your best-selling product frequently purchase another product alongside it, but you're doing absolutely nothing to make that pairing obvious. Maybe two products make more sense as a bundle. Maybe your free shipping threshold is sitting just high enough that customers are adding another item to their cart to reach it. Maybe certain promotions consistently produce larger orders than others.
Those are useful things to know because they give you actual ideas to test.
And you can find AOV in Shopify Analytics, where you can also look at how it's changing over time. I'd pay more attention to those patterns than I would to whether your AOV happened to be $67.42 one random Tuesday.
Honestly, I'd look at both.
Conversion rate and AOV answer different questions, and together they can tell you a lot about where your store may have an opportunity.
If your conversion rate is low but your AOV is healthy, I'd be more interested in understanding why the people coming to your store aren't purchasing before I start throwing more traffic at it.
If your conversion rate is healthy but your AOV is low, I'd start looking at the products people are buying, what they're buying together, how you're merchandising the store and whether there are natural opportunities to increase the value of each order.
And if both numbers are moving in a direction you don't love, that's when I'd start digging deeper into the rest of the customer journey.
Notice what I'm not telling you to do: obsess over every number Shopify gives you.
Analytics should make your decisions easier, not give you another full-time job.
Start with conversion rate and AOV, watch how they change over time, and get curious about what might be causing those changes. Once you understand those two numbers, the rest of your analytics starts becoming much easier to put into context.
Because the goal isn't to look at your Shopify dashboard and know what every metric means.
The goal is to be able to look at the numbers and know what to do with them.